Data visualization application for medical research professionals.
The challenge of the this project was taking on an application halfway through the development cycle. The application was suffering from severe performance issues, and we were able to track the problem down to the manner in which the data was transferred to the client. Utilizing BlazeDS we were able to decrease the amount of time spent consuming services. This dramatically sped up the calculations determining the connectedness of profiles, and yielded positive results with respect to the rendering of this rather complex data.
We were also tasked with enhancing the filter functionality of the application, giving the end user the ability to fine tune the data displayed at any given time. This included diagnosing inefficiencies in the legacy filter code, and building new, complex filters for analyzing different aspects of the profile data. Connection threshold filters, connection type override filters, and secondary connection filters were among these enhancements that now provide many varied perspectives on the relationships between profiles in a data set.
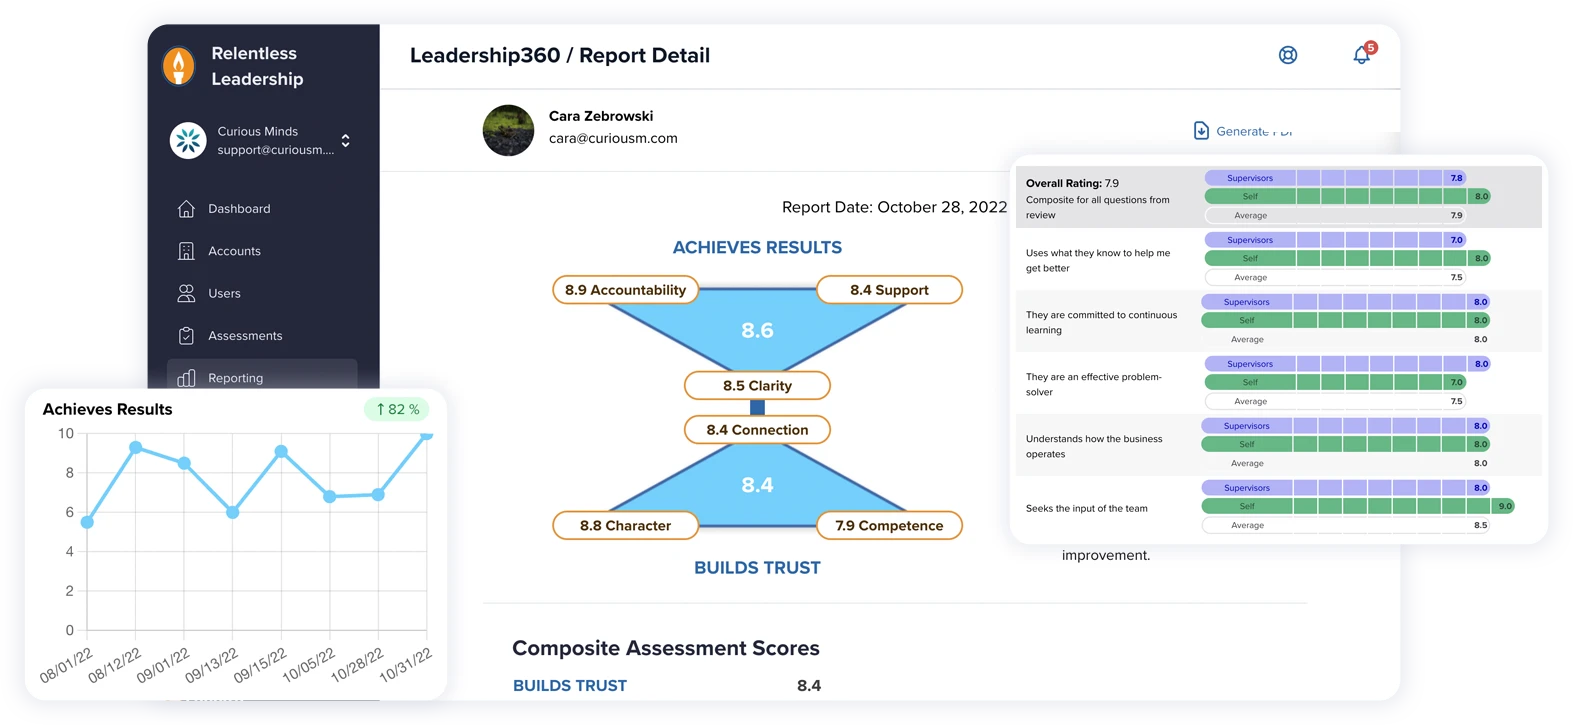
In addition to the Geographical View, we have also leveraged the Flare toolkit to realize an Abstract View, offering yet another angle from which to view the profile data. Manipulating such attributes of the graph as node color, connection color, node saturation, etc. we have created a dynamic data visualization which is not only highly informative, but engaging and easy on the eye.
We have enjoyed working on this project with Heartbeat very much. It has given us the opportunity to ‘resurrect’ an application which was based on very strong concepts and great vision, but that had not been implemented in the most intuitive and efficient manner in code. The challenges presented in this project were varied, from visual programming techniques to intricate serial filtering of data. We also had a lot of fun leveraging some exciting frameworks such as Cairngorm, Flare and making use of Google Maps API for creating this neat little graphing application.
Technologies
Adobe Air SDK Adobe BlazeDS Adobe Flash Builder Adobe Flash Professional CS5 Flex Cairngorm Framework Flare Data Visualization Toolkit Google Maps API
